If I showed you a box and asked you how many apples are in it, you probably wouldn’t be able to give me an exact answer, but you might be able to say “less than 30.” If I asked how long a ladder would need to be to climb over a fence, you could say “2 metres long,” but a longer ladder would also work, so you could also say “at least 2 metres long.” These are examples of inequalities; they express the range of values which would be acceptable, by specifying the ends of those ranges. There are five mathematical symbols to describe inequalities:
“\(\lt\)” and “\(\gt\)” are referred to as strict inequalities, as they do not include the endpoints, so you could say, for instance, that “x is strictly less than 6” for \(x < 6\).
An inequality can also be used to express a range. E.g. suppose we have \(x > 5\) and \(x < 7\), this could be written as one inequality
\[ 5 < x < 7\]
Suppose I want to know the set of values of \(x\) for which
\[ x + 3 < 5\]
I can treat this just as I would any equation, i.e. subtract 3 from both sides and get
\[ x < 2\]
Similarly for addition. In general you can treat an inequality just like you would any equation, with one proviso — if you multiply or divide by a negative number you must swap the direction of the inequality. To illustrate why, consider
\[-5 < -1\] If I multiply both sides by \(-1\) I get 5 on the left, and 1 on the right, and we know that
\[5 > 1\]
Similarly, if I have
\[ -x < -1 \]
I must have
\[ x > 1 \]
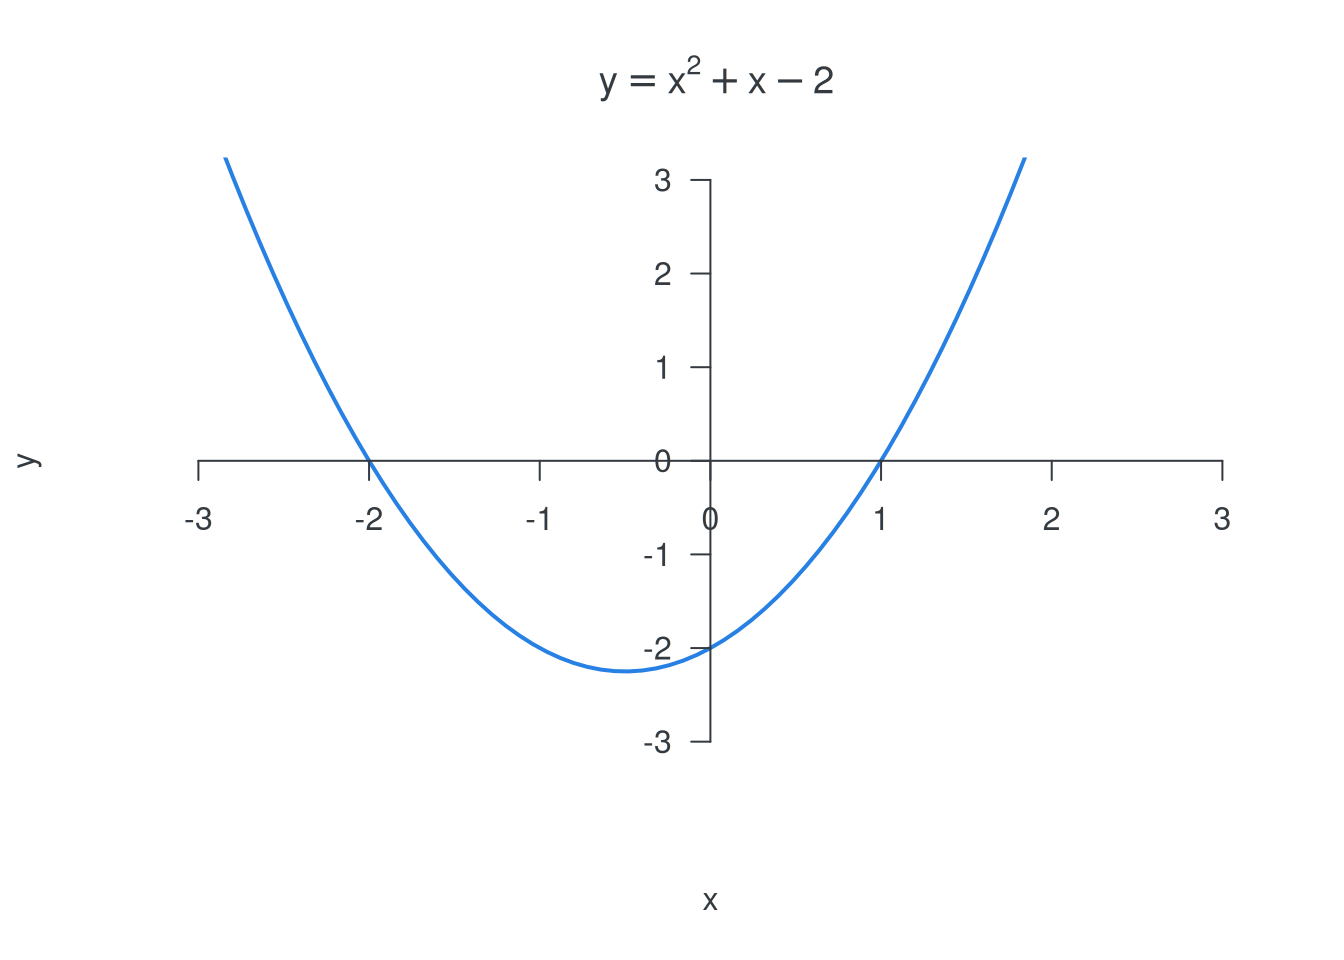
Now consider \(x^2 + x - 2 < 0\). If this were an equation rather than an inequality, i.e. we had \(x^2 + x -2 = 0\), we could factorise it to give \((x+2)(x-1) = 0\) and solve to get \(x=-2\) and \(x=1\). However we have an inequality. Let’s look at the graph of \(y=x^2 + x -2\):
We are interested in when \(y < 0\), which is clearly when
\[-2 < x < 1\]
Similarly if we had been interested in \(x^2 + x - 2 > 0\) we would look at where \(y > 0\) and get
\[ x < -2 \qquad \mathbf{or} \qquad x > 1\]
as the solution.
So, in general for a quadratic inequality: